Equaliser Results
Hardware Setup
Equipment used:
Rigol spectrum analyzer.
Ubuntu PC equipped by LimeSDR-PCIe-5G board.
In order to illustrate the procedure described so far we designed transmitter equaliser with the following specifications:
LMS#2 Transmitter LO frequency: 2.3 GHz
Equaliser clock frequency fclk: 245.76 MHz
Pass band fp: 50 MHz in baseband, 100 MHz in RF
Number of measurement point Nm : 6
Measurement points fi: +/-1 MHz, +/-25 MHz, +/-50 MHz
Number of taps per FIR filter N: 15
The LMS#2 Tx DAC sample rate is 245.76 MS/s, LMS#2 Rx ADC sample rate is 122.88 MS/s
Results
The results are shown in the figures. The Figures 29, 30 and 31 represent the TX chain gain, the IQ gain error and IQ phase error, respectively. Three curves are displayed in each plot.
The curve labelled as “Measured” (red ones) is obtained by measured data, before Equaliser is applied. Based on these, approximating polynomials are fitted and shown as “Approximated” (the blue curves) in the same figures. Although twenty measured points are shown, only six of them are used for polynomial fitting. Others are plotted just for visual checking how the polynomials cope with the points between the measured ones.
The results which are labeled as “Corrected” (green) curves in Figures 29, 30 and 31. represent corrected TX chain gain, IQ gain error and phase error respectively, obtained after the Equaliser operation is applied.
Obviously, TX amplitude response in Figure 29 is much flatter after Equaliser is applied, while IQ gain and phase errors (shown in Figure 30 and 31 )are much closer to the ideal case over the entire pass band.
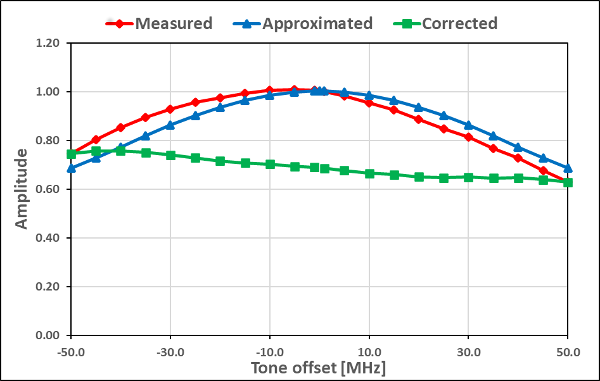
Figure 29: Normalised measured, approximated and corrected amplitude response
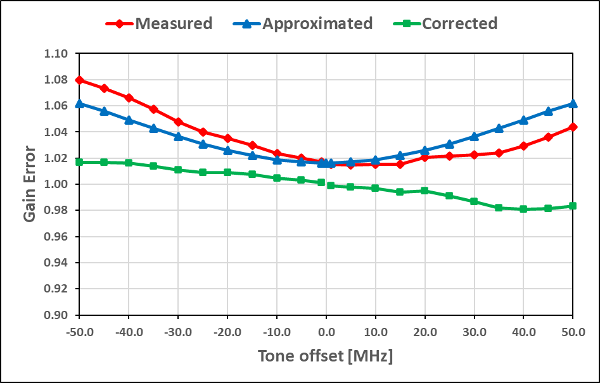
Figure 30: The gain error - the measured, approximated and corrected values
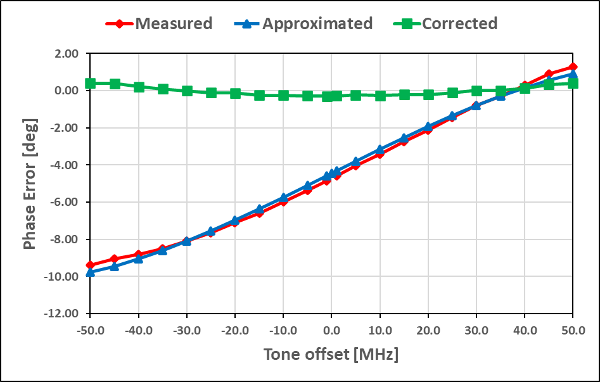
Figure 31: Measured, approximated and corrected phase error
Using “Approximated” curves the FIR filters desired amplitude and phase responses are constructed. They are plotted in Figures 32 and 33.
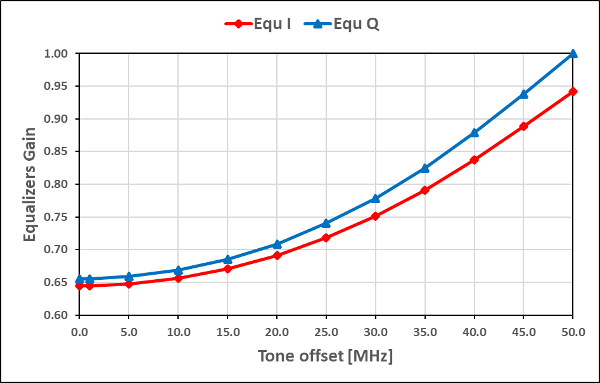
Figure 32: Desired amplitude response of the equaliser
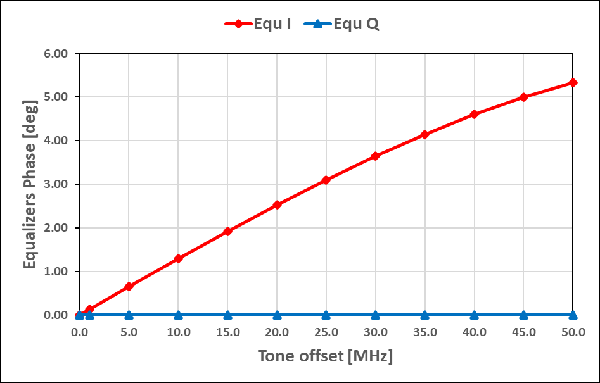
Figure 33: Desired phase response of the equaliser
The figure 34 shows unwanted IQ imbalance image level without (“Initial”) and with the equalisation (“Corrected”). Obviously, almost 20dB improvement is achieved, when equalisation operation is done.
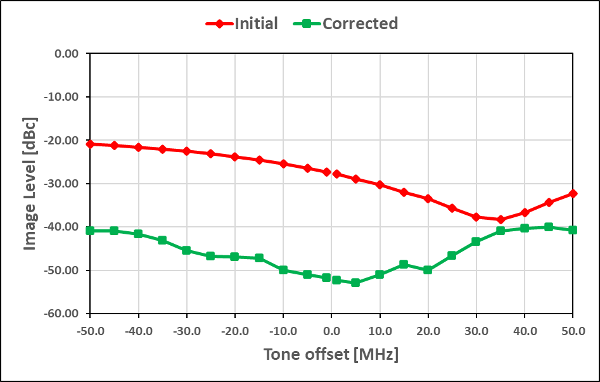
Figure 34: IQ imbalance image level