LimeSDR-QPCIe
Hardware Setup
Equipment used:
Rigol spectrum analyzer.
Ubuntu PC equipped by LimeSDR-QPCIe board.
For channel A, LimeSDR QPCIe TX1_1 output is connected to power amplifier input; for channel B port TX2_1 port is used. The output of power amplifier is via RF attenuator connected to spectrum analyzer RF input. Power amplifier coupling outputs for both transmitter channels are over attenuator fed to LimeSDR QPCIe inputs. RX1_W is used as DPD monitoring input and it is connected to an on-board analog multiplexer output U.FL RFC port. The U.FL RF1 multiplexer input is channel A receive input, while U.FL port RF3 is channel B input.
Data payload is generated by connecting mobile phone(s) to BTS and executing Magic Iperf application on both sides. The case when CFR is bypassed is used as the reference point for the final comparison. In the further measurement points, the CFR block is enabled.
Before implementation and measurements, ADPD algorithm has been thoroughly simulated. Simulation results are omitted from this document for clarity.
Most importantly, ADPD performance has been measured and the results for three cases are presented in this Chapter.
Test Case 1: 10MHz LTE, Maxim Integrated MAX2612 PA
Power amplifier: Psat ~ 19dBm.
RF centre frequency 751MHz.
Test signal: 10 MHz LTE waveform.
ADPD Parameters:
Nonlinearity order: M1=2, M2=0.
Memory order: N1=N2=4.
CFR parameters:
L=17
Th=0.75
Int/Dec=1
PAPR is reduced from 10.32 to 8.34 dB
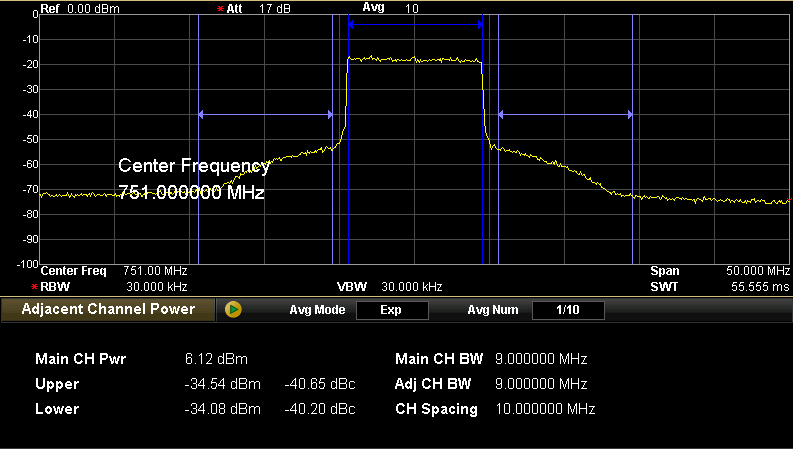
Figure 24: Signal spectrum before linearization.
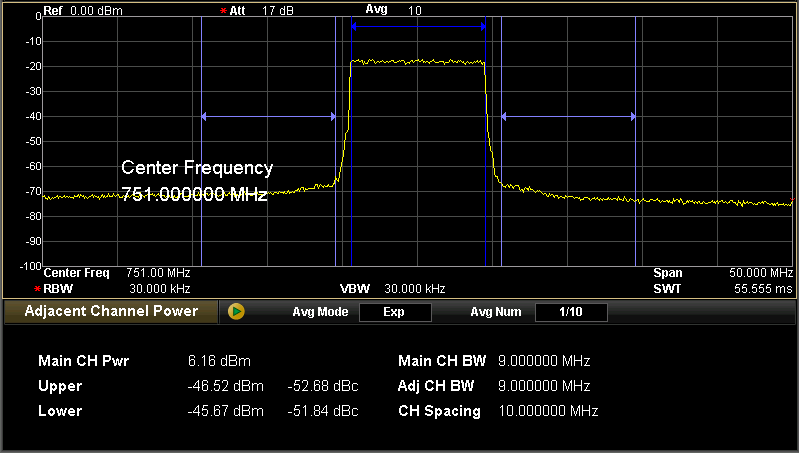
Figure 25: Signal spectrum after linearization.
Before linearization: ACPR = -40.2 dBc; EVM = 3.2%
After linearization: ACPR = -51.8 dBc; EVM = 2.2%
Improvement: Δ ACPR = 11.6 dB; Δ EVM = 1.0%
PA output power is preserved at Pout=6.1 dBm.
Test Case 2: 20MHz LTE, Maxim Integrated MAX2612 PA
Power amplifier: Psat ~ 19dBm.
RF centre frequency 751MHz.
Test signal: 20 MHz LTE waveform.
ADPD Parameters:
Nonlinearity order: M1=2, M2=0.
Memory order: N1=N2=4.
CFR parameters:
L=13
Th=0.75
Int/Dec=2
PAPR is reduced from 10.6 to 8.3 dB.
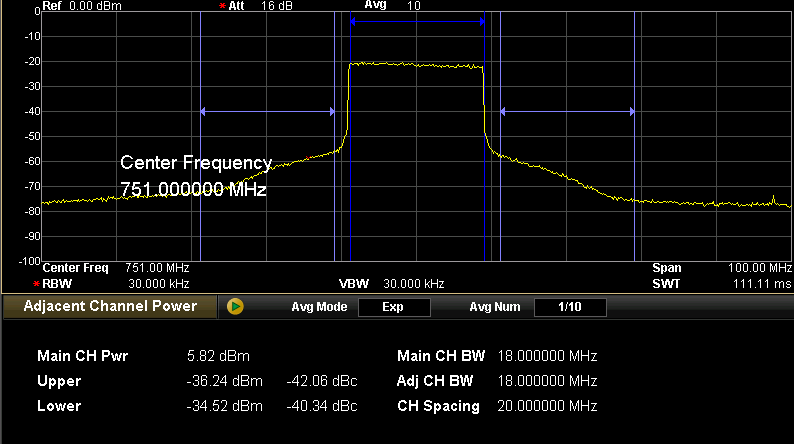
Figure 26: Signal spectrum before linearization.
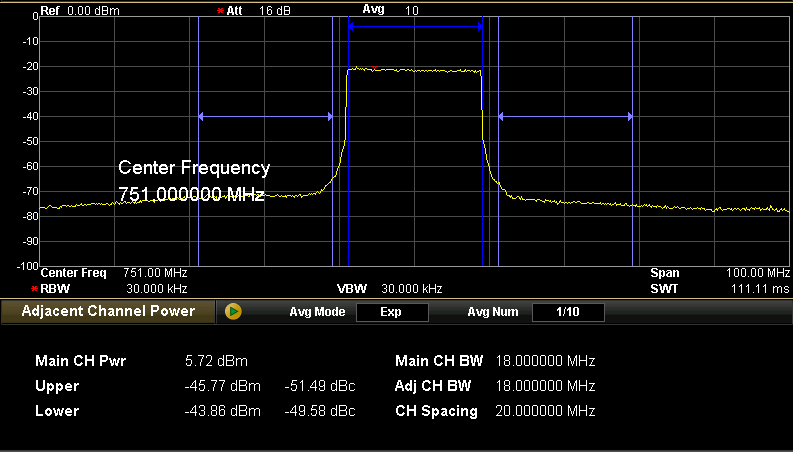
Figure 27: Signal spectrum after linearization.
Before linearization: ACPR = -40.3 dBc; EVM = 3.6%.
After linearization: ACPR = -49.6 dBc; EVM = 2.2%.
Improvement: Δ ACPR = 9.3 dB; Δ EVM = 1.4%.
PA output power is preserved at Pout=5.8 dBm.
Test Case 3: 10MHz LTE, 10W modulated output power amplifier
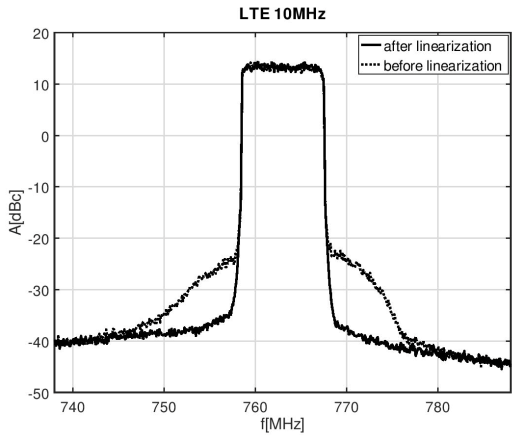
Figure 28: Signal spectrum before and after linearization.
The bandwidth of PA is 700-850 MHz. The average output power at 1 dB compression point is 40 dBm at the frequency of 750 MHz. In the measurement setup, the 30 dB attenuator is put between the output of PA and the RF input of spectrum analyzer.
Before linearization: ACPR=-37.5 dBc, EVM= 3.32 %.
The measured PA output power was Pout=39.7 dBm and the PAPR=10.3 dBm.
After the PAPR is decreased by 2 dBm, by choosing L=19 and Th=0.76, and the PA is being linearized by DPD: EVM = 2.42 %. ACPR = -50.51 dBc.
Therefore, ACPR and EVM are improved by 13.01 dBc and 0.9 % respectively, compared to the results of uncompensated PA.