LimeSDR-PCIe-5G
Hardware Setup
Equipment used:
Rigol spectrum analyzer.
Ubuntu PC equipped by LimeSDR-PCIe-5G board.
For TX channel A, LimeSDR-PCIe-5G LMS1 TX1 output is connected to power amplifier input; for TX channel B, port LMS1 TX2 is used. The output of power amplifier is via RF attenuator connected to spectrum analyzer RF input. Power amplifier coupling outputs for both transmitter channels are over attenuator fed to LimeSDR-PCIe-5G inputs. For RX channel A LMS3 RX1_H input is used; for RX channel B, the LMS3 RX2_H input is used.
The case when LimeADPD I/Q and CFR are bypassed is used as the reference point for the final comparison. In the measurements, static I/Q calibration procedure of the transceiver IC is intentionally bypassed in order to assess the DPD/IQ performance in the presence of static I/Q imbalance.
Test Case 1: LTE 5MHz Low IF, Maxim Integrated MAX2612 PA
Power amplifier: Psat ~ 19dBm.
RF centre frequency 751MHz.
Test signal: 5MHz Low IF LTE waveform.
ADPD Parameters:
Nonlinearity order: M1=3
Memory order: N1=N2=4.
CFR parameters:
L=21
Th=0.75
Int/Dec=1
PAPR is reduced from 10.32 to 8.34 dB
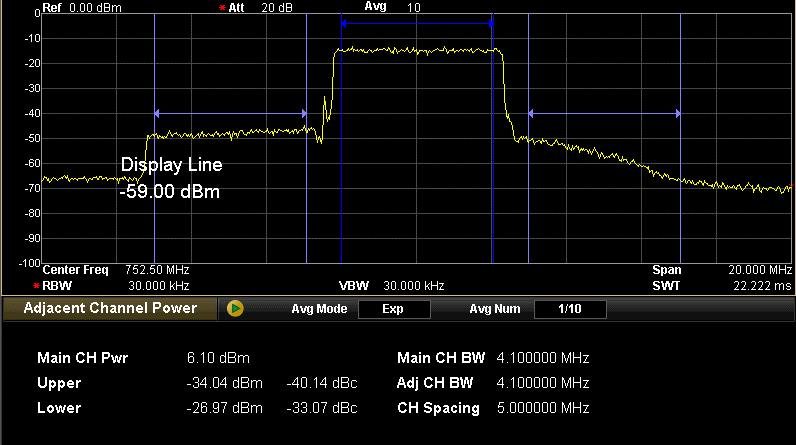
Figure 18: Signal spectrum before linearization.
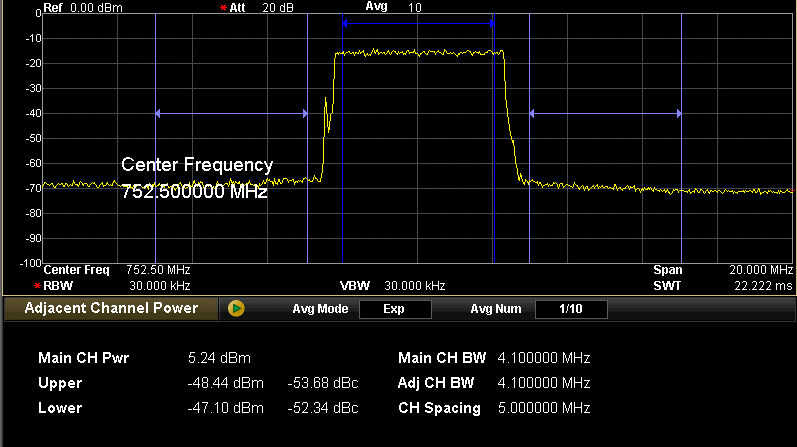
Figure 19: Signal spectrum after linearization.
Before linearization: ACPR (left side) = -33 dBc;
After linearization: ACPR (left side)= -52.4 dBc;
Improvement: Δ ACPR (left side) = 19.4 dB;
PA output power is preserved at Pout=6.1 dBm.
Test Case 2: Ten-tone Low IF, Maxim Integrated MAX2612 PA
Power amplifier: Psat ~ 19dBm.
RF centre frequency 751MHz.
Test signal: Ten-tone Low IF signal with 1MHz tone spacing.
ADPD Parameters:
Nonlinearity order: M1=3,
Memory order: N1=N2=4.
CFR parameters:
L=17
Th=0.75
Int/Dec=2
In order to evaluate the performance of DPD/IQ in I/Q imbalance mitigation, asymmetrical positive-band ten-tone input waveform is used. The output power of ten tone test signal is equal to 3.5dBm. The input waveform is modified by CFR block. The PAPR is reduced from 10.6 to 8.3 dB. Figures 20 and 21 illustrate the results of DPD/IQ operation by showing power spectral densities of PA output with and without using DPD/IQ.
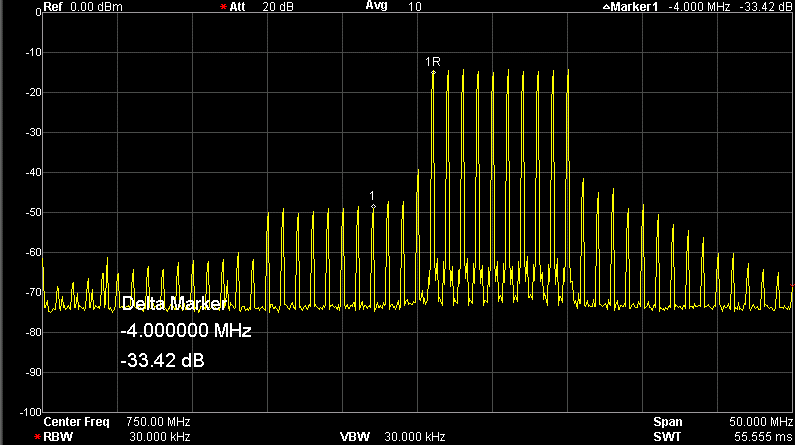
Figure 20: Signal spectrum before linearization.
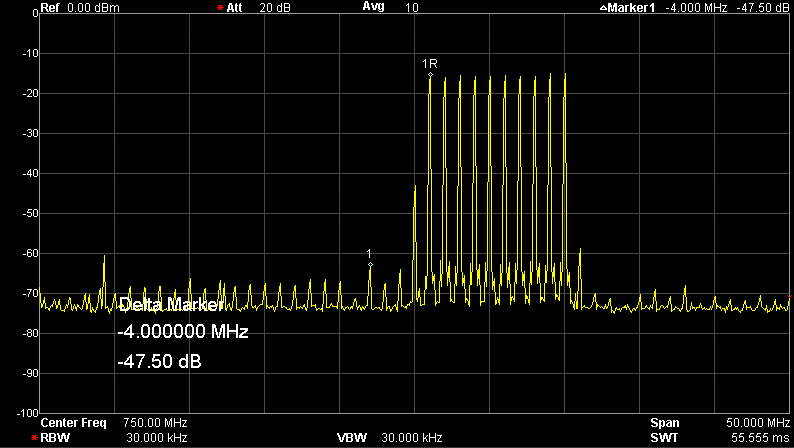
Figure 21: Signal spectrum after linearization.
Before linearization: ACPR (left side) = -29.8 dBc;
After linearization: ACPR (left side)= -46.3 dBc;
Improvement: Δ ACPR (left side) = 16.5 dB;
PA output power is preserved at Pout=3.5 dBm.
Test Case 3: 10MHz LTE, 1W modulated output power amplifier
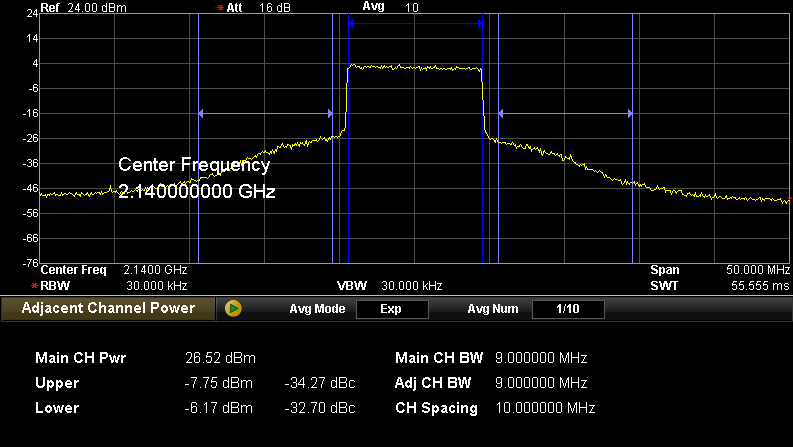
Figure 22: Signal spectrum before linearization.
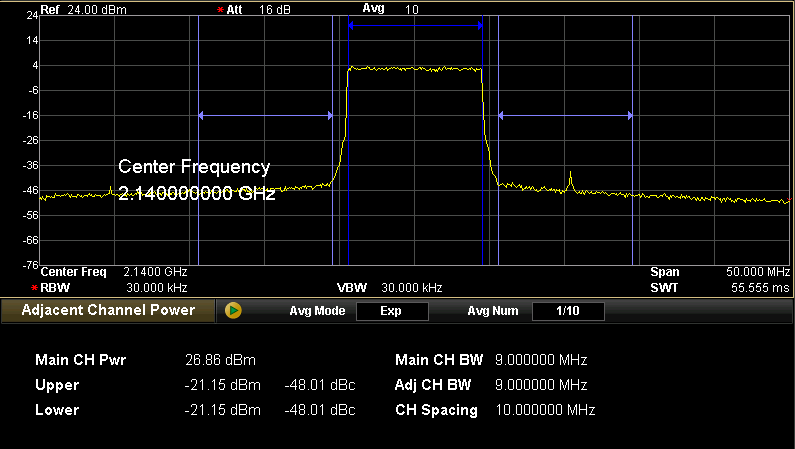
Figure 23: Signal spectrum after linearization.
The average output power at 1 dB compression point is 28 dBm at the frequency of 2.14 GHz.
Before linearization: ACPR=-32.7 dBc, EVM= 3.4 %.
The measured PA output power was Pout=26.5 dBm and the PAPR=10.3 dBm.
After the PAPR is decreased by 2 dBm, by choosing L=19 and Th=0.76, and the PA is being linearized by DPD: EVM = 2.4 %. ACPR = -48 dBc.
Therefore, ACPR and EVM are improved by 16 dBc and 1% respectively, compared to the results of uncompensated PA.